Short Courses
New for SDSS 2027: Your registration includes a short course! Choose from four half-day courses offered on Tuesday and make the most of your meeting experience. Seats are available on a first-come, first-served basis, so register early to secure your spot in your preferred course.
Back to Basics: Data Storytelling for Leaders
In a world drowning in data, sharing it in a clear, insightful, and impactful way is a skill that transcends disciplines. This course isn’t about analyzing data. It’s about what comes after: building a narrative so your analysis inspires action. You’ll learn to plan your story around your audience, select the right graph for your data, and design slides that are easy to process and recall. We’ll also look at how AI changes this work and how to judge whether AI-generated analysis and slides are ready for your audience. Guided exercises let you practice on real examples, then apply the principles to a topic of your choosing.
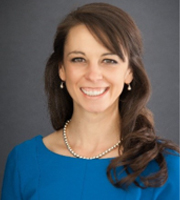
Elizabeth Ricks
Wake Forest University
Characterizing and Coping with LLM Variability
Variability in large language model responses, even to simple prompts, is increasingly of concern to users but remains underappreciated and understudied. We will address challenges and opportunities for statistical scientists, including the following:
- Quantifying variability by treating it as a subject for statistical analysis
- Identifying and resolving multiple sources of variability, such as replications within runs of the same prompt and between runs, as well as over time
- Sense-making in light of variability
- Strategies to reduce variability, which relate to but are not the same as “prompt engineering”
- Accommodating variability in analyses, including ensemble methods
The approach will be heavily empirical, based on the presenters’ and collaborators’ experience with responses to open-ended questions in opera audience survey data, analysis of the Gettysburg Address, and a study of hospital discharge notes designed to assess whether the variability itself varies with patient and hospital characteristics.

Alan Karr
Temple University and JA Analytics & Insights
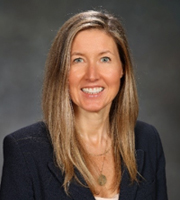
Jeanne Ruane
University of Pennsylvania and JA Analytics & Insights
From Chatbot to Agentic Data Science: AI Tooling for Data Scientists and Statisticians
Data scientists and statisticians tend to sit in one of two places with AI tools. Some haven’t started and want a sensible first step. Others have pushed chatbots as far as they go and moved on to agentic tools, but they’re teaching themselves from material written for generalists or software engineers, and it’s slow going. This half-day course is built for both. No prior experience with AI tools is required.
We’ll work through three parts: an introduction to the current state and capabilities of chatbots (and how to push them to their limits), a hands-on session to build your own AI context files, and an overview and live demonstration of agentic tools.
- Chatbots and where AI tools stand: We’ll start from what AI tools can do for statisticians and data scientists right now, with little or no setup. If you’re new, it’s a gentle start that jumps you to the head of the line. If you’re experienced, it’s a recap of what’s changed (since last week). We’ll review which work is worth handing to AI and which isn’t worth the effort to make AI get it right. We’ll show how to tune a chat tool to your own research with instructions and context files.
- Hands-on session: Whatever your starting point, you’ll leave this session as an AI tool user. You’ll build your own AI context files by adapting worked examples to your research. All it takes is a browser and a chatbot.
- Agentic tools: Agentic tools are the next step in a data scientist’s AI toolkit. They read and write files on your machine, run code, see their own output, and work through a multi-step plan from a single instruction. Much of the guidance on these tools is written for generalists or software engineers, so we’ll give agentic tools the data science treatment. We’ll build a data science project live, from a jumble of files through data prep and ETL to a technical report. Along the way, we’ll cover how to sanity-check what the AI produces.
You’ll also receive a library of context files, templates, and prompts tailored to statistical and data science work, ready to carry forward into your own projects. It includes prompts for statistical consulting and collaboration, worked examples for analyses such as a multisite study, and a generator for messy practice datasets.
Material Requirements
Please bring a laptop with access to a chatbot that accepts document uploads, such as Claude or ChatGPT. The free tier is fine. If you already use agentic tools, for example in VS Code or Posit, you can do the hands-on exercise in your preferred environment.

Glen Colopy
The Data & Science Podcast/Alesca Life Technologies
The Modern Data Scientist: SAS + R + Python + SQL + AI
Today’s data professionals increasingly work across multiple technologies rather than within a single analytics ecosystem. This course provides a practical roadmap for combining SAS, R, Python, SQL, and AI into a modern, flexible data science workflow. Participants will learn how to use SQL for data extraction and transformation, SAS for enterprise analytics, R for statistical computing and visualization, Python for data science and machine learning, and generative AI for productivity and automation. Rather than treating these technologies as competitors, the course demonstrates how they can work together, from data acquisition and preparation through statistical analysis, visualization, predictive modeling, and reporting. Participants will leave with a practical framework for selecting the right tool for the right analytical problem.
Prerequisite Knowledge or Skills
Participants should have the following:
- Basic understanding of data analysis and data science concepts
- Familiarity with datasets containing numeric and categorical variables
- Basic understanding of descriptive statistics
- Basic computer programming experience
- Familiarity with spreadsheets, databases, or an analytical programming language
Participants do not need to be experts in SAS, R, Python, SQL, or AI, but prior experience with any of the following is beneficial:
- SAS programming
- R programming
- Python programming
- SQL
- Statistical analysis
- Data visualization
- Machine learning
- Generative AI/LLMs

Kirk Paul Lafler
sasNerd