Teacher Section
Participant Instructions
Get Started
Share Information About the Census at School Project.
Explain the United States Census
Census at School helps raise students' awareness of civic duty. They learn about the importance of the U.S. Census being taken every 10 years providing essential information to determine representation in the U.S. House of Representatives and for planning education, health, transportation and many other services. Just as your class census will give information about your class, the United States Census provides a picture of our country's population. For more information about the U.S. Census, visit www.census.gov/schools.
Register as a Teacher
Register with your email address and select your teacher password. You will first need to enter your school zip code and school information. You will use your email address and teacher password to sign in, register your classes and export your class results.
Register Your Classes
Go to Teacher Sign-in on the Teacher Section. Enter your email address and teacher password.
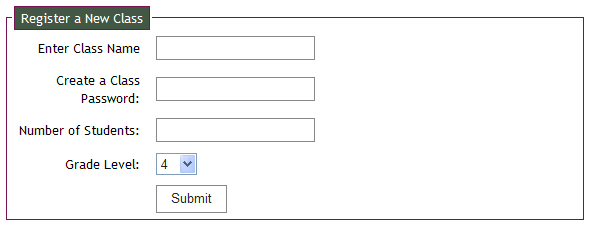
Click on Class Registrations. You can register a new class or access your previously registered classes. To register a new class, select a class name, class password, number of students, and grade level as shown below.

Once submitted, your class information will appear as in the examples below. The system will automatically generate the class ID.

Take note of the class ID and class password. You will need to give these to your students so they can access the online survey in the Student Section. Repeat the registration process for each participating class.
Prepare Your Class and Complete the Survey
Arrange Internet Access
Your students will each need approximately 15–20 minutes of Internet access to complete the online questionnaire. They can do it all at once in a computer lab, or one after the other on the same computer.
If computer access is difficult to provide in your school, you might consider asking students to complete the survey at home as homework.
Have Students Take Measurements
Before completing the survey, students will have to collect and record various body measurements. Refer to the Measurement Guide for instructions about taking the measurements. It will save time to have your students print a hard copy of the survey questions and write down their answers before answering the questions online. Students can test the reaction time and memory tests in the Student Section.
Because this is an international classroom project, measurements will be taken in centimeters for some questions and millimeters for others, as indicated on the questionnaire. Please make sure your students measure using the appropriate metric units as indicated in the questions.
Discuss Security on the Web
The online survey does not collect personal identifiable information from participating students, such as names, addresses, identification numbers, or school information. U.S. Census at School responses are maintained on a secure database controlled by the American Statistical Association. Only teachers have direct access to their own class census results through their password. Before students submit their survey responses online, we recommend teachers review their school internet safety guidelines.
Have Students Respond Online
Students are now ready to use the computers. Provide the students with the Class ID and Class Password to fill out the online survey. Your students will each need approximately 15–20 minutes of Internet access to complete the online questionnaire. They can do it all at once in a computer lab, or one after the other on the same computer.
Get Results
Obtain Your Class Results
Go to the Teachers Section and sign in using your email address and teacher password. Click on Class Registrations. The classes for which you have registered will appear along with each class ID, class name, class password, class size, grade, and number of responses. To export data for a particular class, click Export. Click to either open or save a copy of the class results. The results are provided in comma-separated values (CSV) format, which is a generic format that can be downloaded into spreadsheet software (such as Excel) or data analysis software (such as Fathom).
Obtain a Random Sample of U.S. Data
The U.S. Census at School Random Sampler provides a random sample of responses from students participating in the U.S. Census at School program. Class participation and student responses are voluntary and do not represent a random sample of students in individual states or the United States. To download a random sample of U.S. Census at School data, click on the Random Sampler. Follow its directions to request a random sample of survey responses from students participating in U.S. Census at School.
Obtain a Random Sample of International Data
Census at School New Zealand now hosts the random sampler for the international Census at School data, the New Zealand data, and also for the cleaned USA data. Their online random sampler allows students and teachers to take random samples up to size 1000 from the international, New Zealand, or U.S. database and either download the data or start up the free, online iNZight Lite software with the data already loaded and ready for analysis. The international database includes data from Australia, Canada, New Zealand, the United Kingdom, and the United States. Census at School – United States also provides a Random Sampler tool to generate a sample of USA Census at School data. This provides access to the messy U.S. data that has not been cleaned. For more information, see the article in Statistics Teacher.
Combine Data Sets
You may wish to analyze these three data sets (your class census, random sample of U.S. students, and random sample of international students) separately to create separate graphs and numerical summaries for comparison. To create side-by-side comparisons in the same graph, combine the data sets using spreadsheet software or statistical software. Make sure all the variable names and columns match for the data sets you wish to combine. Before combining data sets, add a new variable (possibly called "Dataset") to each of the data sets with three possible values such as "Class," "USA," and "International" to distinguish between your class census, the U.S. random sample, and the international random sample.
Within the column for the new "Dataset" variable, assign the value "Class" for each student in your class. Assign the value "USA" for each student in the USA sample, and assign the value "International" for each student in the international sample. The data sets should combine correctly, as long as your variable names and columns match for all the data sets, including the new "Dataset" variable.
The international random sample contains the data for the 13 international questions common to each participating country, while your class census and random sample from U.S. participants will contain additional variables corresponding to the additional USA questions.
Analyze the Census at School Data
Statistical Problemsolving and Investigation
Census at School data will provide opportunities for students to practice the statistical problemsolving process by formulating questions of interest that can be answered with the Census at School data, collecting/selecting appropriate data, analyzing the data, and making appropriate conclusions in context. For more about the statistical problemsolving process, see the Guidelines for Assessment and Instruction in Statistics Education (GAISE) Report: A Pre-K–12 Curriculum Framework at www.amstat.org/education/gaise.
To begin, ASA recommends watching the webinars titled "Exploring Census at School Data from Around the World with Fathom," "Exploring U.S. Census at School with Fathom-Looking for Patterns" and "Analyzing Census at School Data with StatCrunch." These can all be found under Resources. These webinars introduce statistical problemsolving in context of Census at School data, which provides practice asking questions, selecting the appropriate data, analyzing the data using software, and making appropriate conclusions in context. There are also other instructional webinars on other K–12 statistics education topics available at www.amstat.org/education/k12webinars. You also may wish to review "Teaching Data Analysis as an Investigative Process with Census at School," a PowerPoint presentation that reviews statistical problemsolving, variables, appropriate graphs, and numerical summaries in context of Census at School.
Real Data Requires Careful Observation and Cleaning
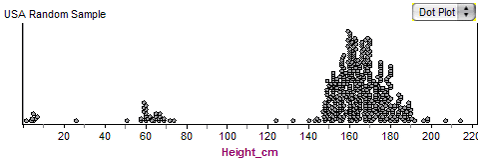
Because the Census at School data comes from real students and is entered online by these students, there will be some mistakes and inappropriate data values in the data sets. Before analyzing your data and making conclusions, make sure to take time to observe and clean your data. Create a graph for each variable of interest to look for inappropriate or unusual values that do not make sense in context of the variable and original survey question. The following graph displays the distribution of heights from a random sample of 500 students from the U.S. Census at School database.

The majority of the height values form a bell-shaped mound of reasonable student heights measured in centimeters. There are two other clusters in this distribution that do not represent reasonable student heights measured in centimeters, considering that the world's shortest person is 50 cm tall. In this case, these two clusters are consistent with students mistakenly measuring their height in feet (cluster on the far left) and inches (cluster in the middle) instead of in centimeters, as directed. There could be unrealistically large or small height values in the data set that distort the overall graph of the distribution and would distort any corresponding numerical summaries. Select your graph scale based on plausible values of the variable and focus your analysis on reasonable and plausible values of the variable. For a discussion about how to deal with these implausible values, watch the webinars "Exploring U.S. Census at School with Fathom-Looking for Patterns" and "Analyzing Census at School Data with StatCrunch," posted under Resources.
Use the Learning Activities
Learning activities and resources will continue to be added to the U.S. Census at School web site under Resources. There are also lessons and learning activities from the international Census at School websites. These ready-to-use activities designed by international teachers help students graph and analyze their own survey data and compare them with national and international results. You can also adapt these international lesson plans for use with U.S. Census at School data.
Share Your Census at School Lesson Plans
As you participate in Census at School and create your own activities and lesson plans using Census at School data, we hope you will consider sharing them. The editor of Statistics Education Web (STEW), an online bank of peer-reviewed lesson plans for K–12 teachers of mathematics and science, is accepting submissions of lesson plans that showcase the use of statistical methods and ideas in science and mathematics based on the framework and levels in the Guidelines for Assessment and Instruction in Statistics Education (GAISE) Report: A Pre-K–12 Curriculum Framework. Please consider submitting your favorite lesson plans according to the STEW template. We also will post published STEW lesson plans relating to Census at School on the Census at School resources web page. For more information about submitting lesson plans, visit www.amstat.org/education/STEW.
The online survey questions and materials have been adapted from the International Census at School survey questions and materials and those of the other participating countries, available through www.censusatschool.com.