| Statistics in the Community (STATCOM) |
|
P-12 |
|
What STATCOM uses to advertise its P-12 Outreach services. Various Links to P-12 Documents Found on the Internet:
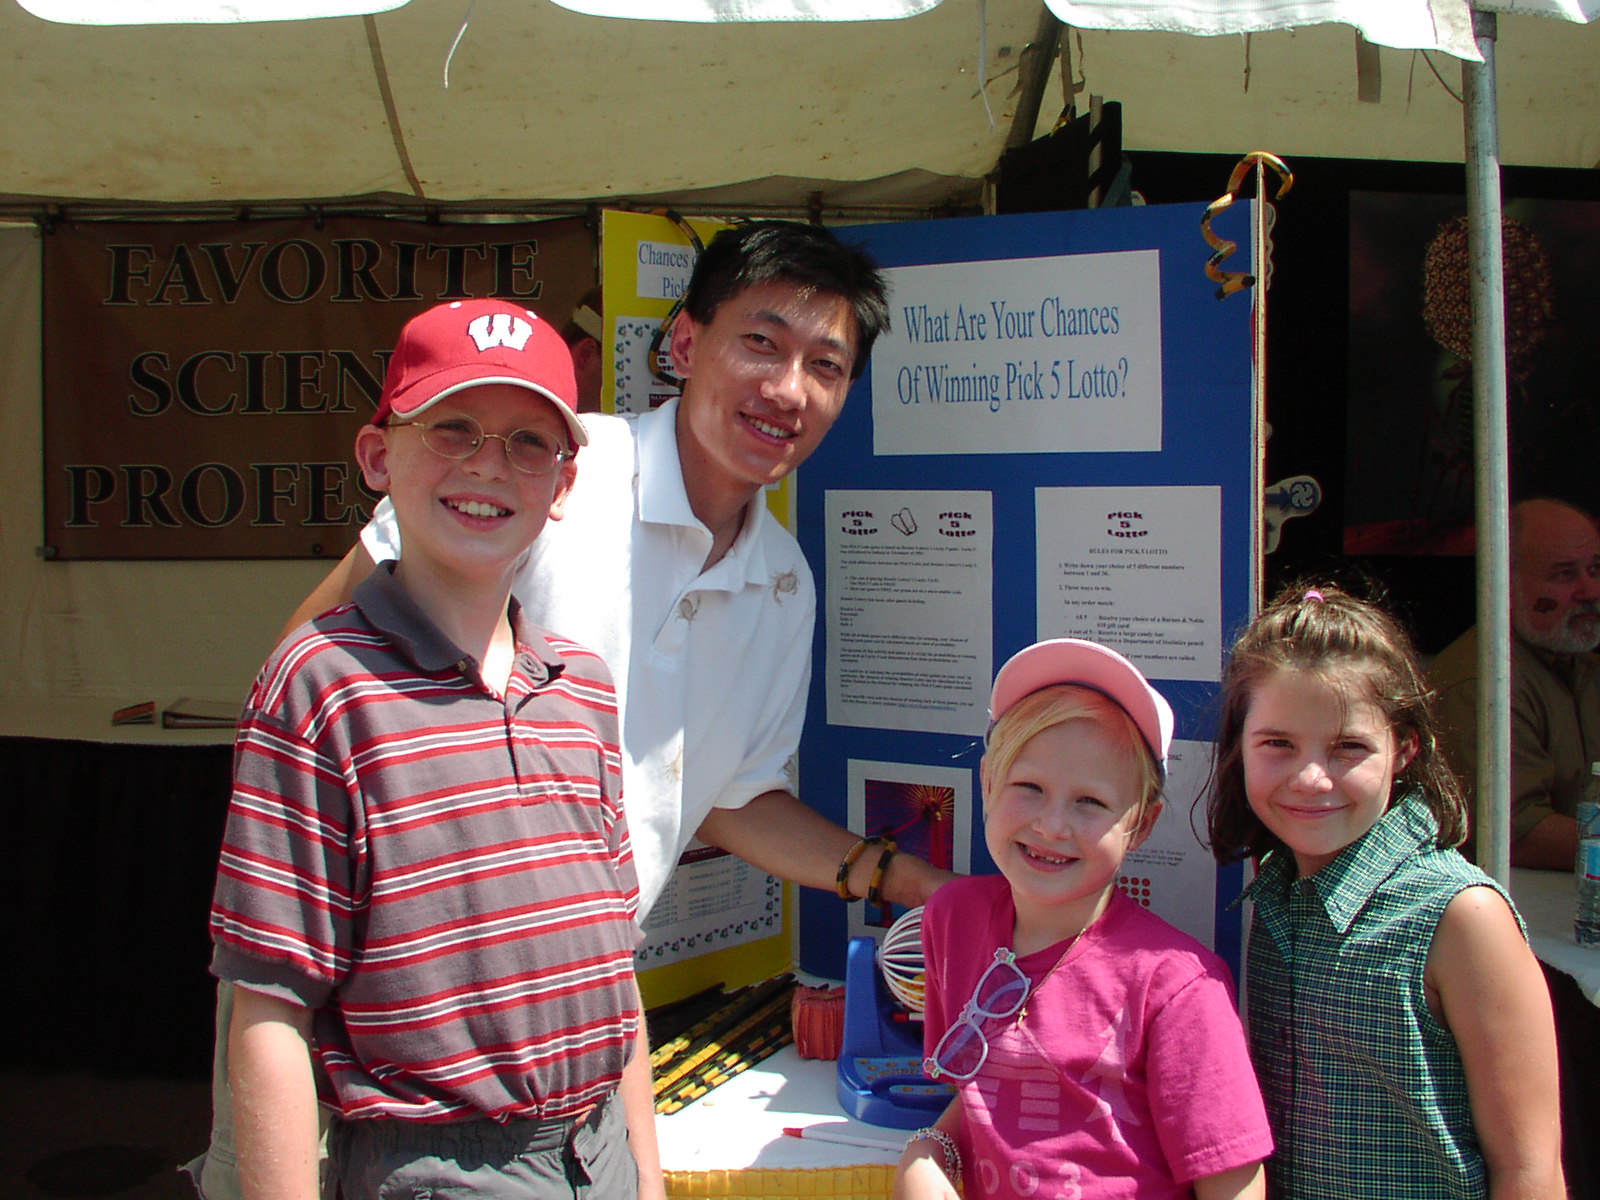
The following activities will be
useful to any group interested in starting the P-12
Outreach component of the Statistics in the Community (STATCOM)
program. Materials for these activities are freely
available upon request. Please contact
Sample Activities: Counting E's Goal: Students learn the difference between a census and a sample by counting e’s in a fun paragraph. Advantages and disadvantages of both methods are discussed. Supplies Needed: Paragraph Pick 5 Lotto Goal: Students learn rules of probability via a simulation of a lottery game. Calculation demonstration: Chances of picking 3, 4, or 5 numbers correctly when picking 5 unique numbers from 1-36. Supplies Needed: Bingo set, small pieces of paper, pens, prizes, handout Statistics with M and Ms Goal: Children learn concepts of using graphs to identify trends by creating a bar graph of the M & M colors in their bag. Supplies Needed: Fun-sized bags of M & M’s, crayons, M &M bar graphs Guess How Many Game Goal: Students learn concepts of maximum likelihood estimation by guessing the highest number in a bag of tokens and pooling information. Supplies Needed: Poker chips (tokens) with numbers, bag, handout Age Histogram Goal: Children learn a way to view the ages of all people who visited the P-12 Outreach Booth at Spring Fest 2005. Supplies Needed: Posterboard with histogram, markers, display stand
|
| STATCOM Materials Version 2.0 © 2006 | Design by My Arts Desire |