G. Steven Rhiel and Wilkie W. Chaffin
Old Dominion University
Journal of Statistics Education v.4, n.3 (1996)
Copyright (c) 1996 by G. Steven Rhiel and Wilkie W. Chaffin, all rights reserved. This text may be freely shared among individuals, but it may not be republished in any medium without express written consent from the authors and advance notification of the editor.
Key Words: Sample size; t critical value; t test statistic; z critical value.
In this article we investigate the large-sample/small-sample approach to the one-sample test for a mean when the variance is unknown, using the probability of a Type I error as the criterion of interest. We show that in most cases using a t-test (t critical value) provides a more robust test than does using the z-test (standard normal critical value). The only case in which z has some advantage is when using a small sample from a parent population with extremely high kurtosis or with skewness in the direction of the rejection region tail. The implications for teaching the large-sample/small-sample approach in introductory statistics classes are discussed in light of these findings.
1 Many basic statistics textbooks present a large-sample/small-sample approach to the one-sample test for a mean when sigma is unknown. (This approach was used in eight of sixteen textbooks selected from the offices of two college professors who teach elementary statistics.) The appropriate test statistic for conducting this test when the population distribution is normal is
t = (\bar{X} - mu)/(S/\sqrt{n}) (1).
The authors of many basic statistics textbooks suggest conducting this test when n >= 30 by using the formula in (1), but replacing the t critical value with a z critical value. This is presented in most of these textbooks by modifying formula (1) to
z = (\bar{X} - mu)/(S/\sqrt{n}) (2).
(Seven of the eight textbooks identified above as using the large-sample/small-sample technique use this substitution.) This provides a means for conducting the test for sample sizes of 30 or more without having to acquire a t critical value.
2 It appears that about half the authors of basic statistics textbooks disregard the large-sample/small-sample distinction and use the t-test regardless of sample size. They rely on studies showing that the t-test is reasonably robust against the violation of the normality assumption for large sample sizes, except for extremely skewed populations (see Bartlett 1935; Bradley 1980; Geary 1947; Pearson and Please 1975; Pocock 1982; Scheffe 1959; and Subranmanian, Subranmanian, and Messeri 1975). On the other hand, Pocock (1982) established that for an extremely skewed, L-shaped population, t does not converge to normality until the sample size is very large, and Geary (1947) and Pearson and Please (1975) found that parental skewness had an effect on Type I error rates for one-sided tests. However, our extensive review of literature did not uncover any research that compares the use of t and z critical values when conducting a one-sample test for a mean (sigma unknown) for various sample sizes when parent distributions are not normal.
3 Because so many textbooks simply replace the t statistic with a z statistic when n >= 30, it follows that many students of elementary statistics are taught or learn from a textbook that the t statistic is appropriate when n <30, and a z statistic is appropriate when n>= 30. In reality, for samples from the normal distribution, the z critical value is an approximation to the t critical value when n >=30, but the distribution remains a t.
4 Moreover, when using the computer to conduct this test, t is used regardless of the sample size, making the z approximation irrelevant. With the expanding use of statistical software, a discrepancy is developing between what is learned in some classrooms or stated in some textbooks and what is done in practice.
5 Should the large-sample/small-sample distinction continue to be taught in basic statistics courses? It would seem from the above discussion that the answer would be no, if considering only the case where the population distribution is normal. What remains to be determined is whether there is any advantage to using the z critical value when the population is non-normal. The following questions will be answered in this study.
6 Computer simulation was used to provide answers to the above questions. Tail probabilities associated with critical t and z values were simulated for a one-sample test for a mean (sigma unknown) for samples from the populations defined below. (In these definitions, Gamma1 = E(Y^3) and Gamma2 = E(Y^4) - 3, where Y = (X - mu)/sigma.)
         a)  A slightly flat distribution with pdf


             f(x) = (.25)\sin(.5x)      0 <= x <="2(3.14159)." b) A uniform distribution with pdf f(x)="1" 0 <="x" <="1." c) A U-shaped distribution with pdf f(x)=".291e^(-x)" 1 <="x" <="0" 0 <="x" <="1."
7 Samples of sizes n = 10 (10) 100 (20) 200 were simulated from the above distributions. Forty thousand simulations were used for each sample size for each parent distribution. From the simulations, the observed proportions of calculated t values falling beyond both the 1% and the 5% critical t and z values were determined and compared to the nominal level of significance. Wardrop (1995) reported a similar simulation study of confidence intervals for the mean. He compared the proportion of 5000 simulated intervals that contained the population mean to the nominal confidence level.
8 In addition to simulating the probability of a Type I error (alpha) for the test, power was simulated for mean shifts of .5 sigma and 1 sigma for those non-normal parents where the use of t and/or z critical values results in conservative tests (i.e., a smaller-than-nominal alpha). The simulated power was compared to the power predicted by normal theory to ascertain whether the power of the test diminishes when the test becomes conservative.
9 Previous research has shown that when the parent distribution is skewed the two tail areas of the sampling distribution may differ drastically (see Chaffin and Rhiel 1993). In this case, we determined the proportion of calculated t values in each tail of the sampling distribution separately, as well as in the two tails combined. When the parent distributions are symmetric, we consider only the combined tails.
10 All samples from the parent distributions were generated using algorithms in Version 1.1 of the IMSL statistical library (IMSL, Inc. 1989) and were tested for accuracy before conducting the simulation.
11 It is a commonly accepted practice to replace the t critical value with a z critical value when conducting a one-sample test for a mean (sigma unknown) with a sample size of at least 30 (see, for example, Hamburg and Young 1994 and McClave and Benson 1991). When the population is normal, this practice results in an actual probability of Type I error that is slightly different from the nominal level of significance (NL), the researcher-specified level. We define the robust level of significance (RL) to be the actual probability of Type I error when using the z critical value in place of the t critical value when the sample size is 30. Thus, for a one-sided test, RL is the probability that a variable with a t(29) distribution will exceed the z critical value corresponding to the level NL. The difference between NL and RL is the basis for our definition of robustness. We consider that a test is robust if the actual level of the test differs from the nominal level by no more than (RL - NL). Thus, a test is considered robust if the actual level falls within the following upper and lower bounds for robustness:
Upper Bound = NL + (RL - NL)
Lower Bound = NL - (RL - NL).
By using this definition with non-normal populations, we can compare the robustness of t and z under parental non-normality to their robustness under parental normality.
12 Table 1 contains the upper and lower robustness bounds for nominal levels of .01 and .05 for two-tailed tests and .005 and .025 for one-tailed tests. From this table we see that the one-sample test for a mean is considered to be robust at the .01 level if the actual alpha is between .00464 and .01536 and at the .05 level if the actual level is between .04033 and .05967. This is consistent with the definitions of robustness used by Bradley (1980) in his study of the effect of sample size on the robustness of the Z, t, and F tests. Bradley considered a test to be robust for an alpha of .05 if the actual alpha was within 20% of the nominal alpha (between .04 and .06) and for an alpha of .01 if the actual level was within 50% of the nominal alpha (between .005 and .015). With rounding, this coincides with the robustness levels we are using.
13 To acknowledge the sampling error associated with the simulation, 95% confidence limits were calculated by multiplying the simulation error by 1.96. The simulation error was calculated as follows:
Simulation error = \sqrt{alpha(1 - alpha)/(# of simulations)}.
The upper and lower confidence bounds for nominal levels of .01 and .05 for two-tailed tests and nominal levels of .005 and .025 for one-tailed tests are given in Table 1.
Table 1: Robustness and Confidence Bounds for the Various Nominal Levels of Alpha
      ----------------------------------------------------------
                                  Robustness        Confidence
                                --------------    --------------
             Nominal   Robust   Lower    Upper    Lower    Upper
      Tails  level     level    bound    bound    bound    bound
      ----------------------------------------------------------
        2    .01      .01536   .00464   .01536   .00366   .01634
        2    .05      .05967   .04033   .05967   .03819   .06181
        1    .005     .00768   .00232   .00768   .00163   .00837
        1    .025     .02983   .02017   .02983   .01864   .03136
      ----------------------------------------------------------
14 Figures 1 through 10 show graphically the simulated probabilities of Type I error (alpha) for one-sample tests for means (sigma unknown) using t and z critical values. In each figure, the dark gray area indicates the robustness bounds; the light gray area shows the confidence bounds for the simulation.
15 Figures 1 and 2 show the simulation results for samples from normal and low kurtosis distributions for nominal levels of .01 and .05, respectively. The results for the normal parent are included in these and other figures for comparison with the results for non-normal parents. For the normal parent we see, as expected, that the simulated alphas for t critical values are equal to or close to the nominal level for all sample sizes. (The slight deviations from the nominal level are a result of the simulation.) The simulated alphas for z critical values are quite large for small n and approach the nominal level with increasing sample size. By sample size 30, the observed alpha for z critical values is within the confidence bounds associated with robustness.
 Figure 1 (8.6K gif)
Figure 1. Comparison of Observed Alphas for t and z at the .01 Nominal Level for Samples from the Normal and Low Kurtosis Distributions. The dark gray area indicates the robustness bounds; the light gray area shows the confidence bounds for the simulation.
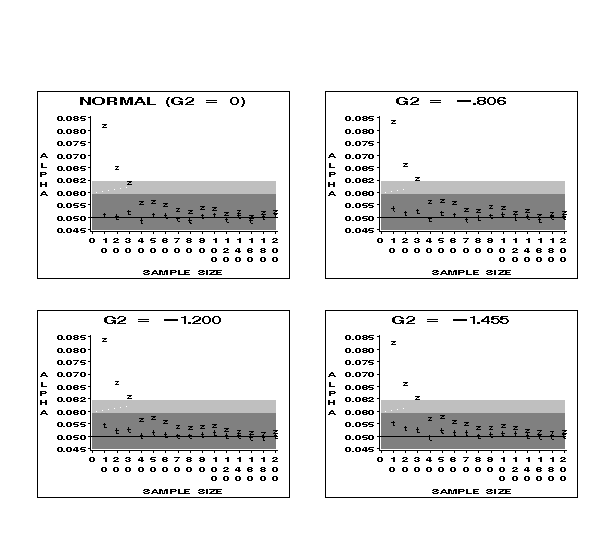 Figure 2 (8.7K gif)
Figure 2. Comparison of Observed Alphas for t and z at the .05 Nominal Level for Samples from the Normal and Low Kurtosis Distributions. The dark gray area indicates the robustness bounds; the light gray area shows the confidence bounds for the simulation.
16 As kurtosis decreases (that is, as Gamma2 = G2 decreases), the effect on the observed alphas for z critical values is slight (Figure 1); robustness is obtained for a sample size between 30 and 40 for each non-normal parent. The test using t critical values is robust for all sample sizes for all four distributions and both nominal levels, except for the single case of G2 = -1.455, n = 10, alpha = .01. In this case, the observed alpha is within the confidence bounds.
17 Figures 3 and 4 contain information about the robustness of tests using z and t critical values for samples from the normal and high kurtosis distributions. Both t and z are robust for sample sizes of 30 or more and, in many cases, for sample sizes of 20 or more, for all the high kurtosis distributions at both the .01 and .05 nominal levels. In addition, t is robust beginning at about sample size 10 at the .01 and .05 nominal levels for all non-normal parents, except when G2 = 4.69. However, z lacks robustness for several of the high kurtosis distributions at both the .01 and .05 levels for n = 10 and at the .05 level for n = 20.
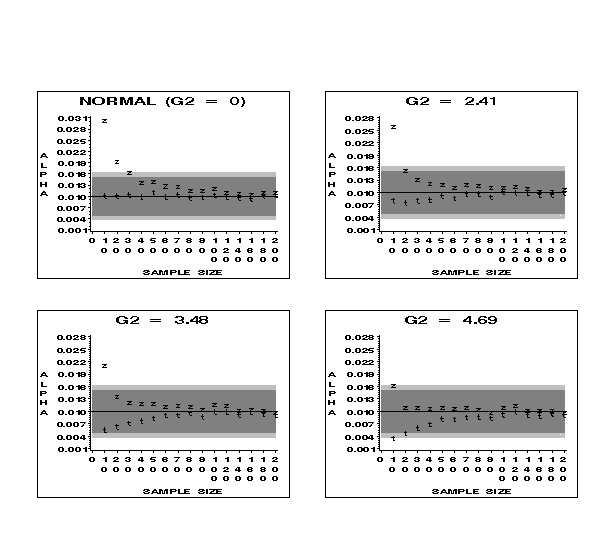 Figure 3 (8.7K gif)
Figure 3. Comparison of Observed Alphas for t and z at the .01 Nominal Level for Samples from the Normal and High Kurtosis Distributions. The dark gray area indicates the robustness bounds; the light gray area shows the confidence bounds for the simulation.
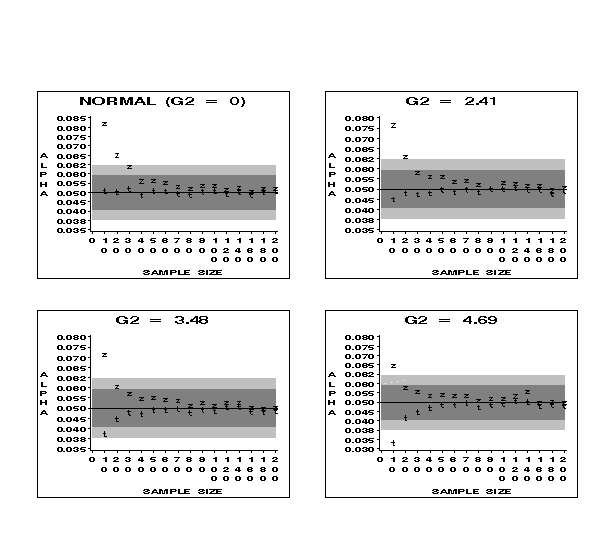 Figure 4 (9K gif)
Figure 4. Comparison of Observed Alphas for t and z at the .05 Nominal Level for Samples from the Normal and High Kurtosis Distributions. The dark gray area indicates the robustness bounds; the light gray area shows the confidence bounds for the simulation.
18 For the smaller sample sizes, although use of the t critical value is generally more robust than use of z, t becomes less robust and z becomes more robust as kurtosis increases. Because t is conservative, its decrease in robustness is of concern only if its power decreases as well.
19 Table 2 contains information about the power of t for the normal parent and the power of t and z for the high-kurtosis parent with G2 = 4.69. We see from this table that t has higher power for the high kurtosis parent than for the normal parent. Because of this and the associated decrease in the probability of a Type I error, the test is "stronger" for the high-kurtosis parent than for the normal parent.
20 It should be noted that the power of z is greater than that of t when G2 = 4.69, but only marginally for n >= 30. This is expected because the observed alpha is larger for z than for t.
Table 2: Power of t and z For the Normal and Contaminated Normal (G2 = 4.69) Parents For Mean Shifts of .5 Sigma and 1 Sigma For One-Tail Nominal Levels of .01 and .05
      ----------------------------------------------------------
                        .01 nominal level     .05 nominal level
                        ------------------    ------------------
                        Normal   G2 = 4.69    Normal   G2 = 4.69
                        ------   ---------    ------   ---------
      Mean shift   n      t      t      z       t      t      z
      ----------------------------------------------------------
      .5 sigma    10     .10    .20    .34     .29    .42    .50
                  20     .30    .38    .46     .56    .61    .65
                  30     .50    .54    .61     .75    .76    .78
                  40     .67    .69    .73     .87    .86    .88

      1 sigma     10     .50    .60    .74     .80    .80    .85
                  20     .93    .90    .93     .99    .97    .98
                  30     .99    .98    .99     .99    .99    .99
                  40     .99    .99    .99     .99    .99    .99
      ----------------------------------------------------------
21 Figures 5 and 6 contain results for skewed parent distributions for two-sided hypothesis tests. We see from these figures that tests based on both t and z critical values require larger and larger sample sizes to obtain robustness as skewness increases, but t is consistently more robust than z, especially for the smaller sample sizes.
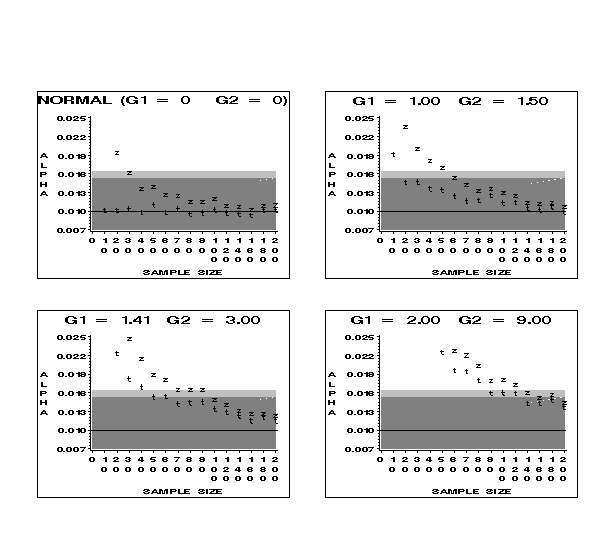 Figure 5 (8.8K gif)
Figure 5. Comparison of Observed Alphas for t and z at the .01 Nominal Level for Samples from the Normal and Skewed Distributions. The dark gray area indicates the robustness bounds; the light gray area shows the confidence bounds for the simulation.
 Figure 6 (9K gif)
Figure 6. Comparison of Observed Alphas for t and z at the .05 Nominal Level for Samples from the Normal and Skewed Distributions. The dark gray area indicates the robustness bounds; the light gray area shows the confidence bounds for the simulation.
22 For the parent distribution with slight skewness (Gamma1 = G1 = 1.00), t is consistently robust for n >= 20, while z is not robust even for n = 40 (n = 30 if simulation error is considered). For the moderately-skewed (G1 = 1.41) and extremely-skewed (G1 = 2.00) parent distributions, sample sizes much larger than 30 are needed to obtain robustness for t or z. There is an exception to this at the .05 nominal level for G1 = 1.41, where t is robust for n >= 30 if simulation error is considered.
23 Figures 7 and 8 contain simulated alpha levels for upper-tail tests for normal and skewed parent distributions. (In cases where only one tail of the sampling distribution is investigated, the nominal levels are .005 and .025.)
 Figure 7 (9.5K gif)
Figure 7. Comparison of Observed Upper-Tailed Alphas for t and z at the .005 Nominal Level for Samples from the Normal and Skewed Distributions. The dark gray area indicates the robustness bounds; the light gray area shows the confidence bounds for the simulation.
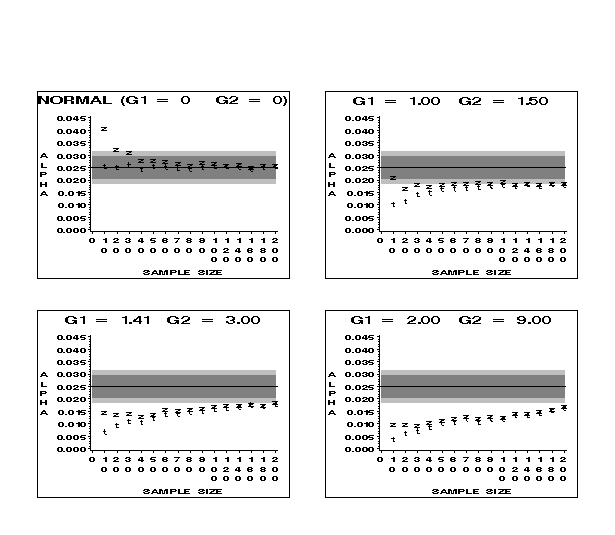 Figure 8 (8.6K gif)
Figure 8. Comparison of Observed Upper-Tailed Alphas for t and z at the .025 Nominal Level for Samples from the Normal and Skewed Distributions. The dark gray area indicates the robustness bounds; the light gray area shows the confidence bounds for the simulation.
24 We see from these figures that t and z are both conservative for upper-tail tests for positively-skewed parents; i.e., the actual level of significance is less than the nominal level. In some cases z is robust for n = 10, loses its robustness as it converges toward t, and regains its robustness as both z and t converge toward the nominal level.
25 From these figures we see that t is less robust than z until the sample size gets quite large. For the parent distribution with slight skewness (G1 = 1), z exhibits robustness or near robustness for most sample sizes, whereas t requires a sample size substantially larger than 30. This is also the case when considering simulation error for the distribution of moderate skewness (G1 = 1.41) at the .005 nominal level. For the other parent distributions, very large sample sizes are needed to obtain robustness for both z and t.
26 In the above cases where t and/or z lack robustness because of skewness in the parent distribution, they do so on the conservative side. Therefore, the real concern is whether the decrease in the probability of a Type I error is associated with a corresponding decrease in power.
27 Table 3 contains information concerning the power of t for the normal parent and the power of t and z for the skewed parent distributions for upper-tail alternatives. From this table we see that both t and z are as powerful for the skewed parents as is t for the normal parents when n >= 30.
28 For some of the smaller sample sizes, the power of z is slightly greater than that of t, especially for a mean shift of .5 sigma. In these cases, z may provide a superior test to t in terms of power, while maintaining an observed alpha that is no larger than the nominal level. On the other hand, although t has less power than z, it has the advantage of a smaller alpha.
Table 3: Power of t and z For the Normal and Chi-Square Parent Distributions For Mean Shifts of .5 Sigma and 1 Sigma For One-Tail Nominal Levels of .005 and .025
      -----------------------------------------------------------------
                                             Chi Square Parents
                                      ---------------------------------
                              Normal     8 df        4 df        2 df
                              ------  ---------   ---------   ---------
      Level  Mean shift   n      t     t     z     t     z     t     z
      -----------------------------------------------------------------
      .005   .5 sigma    10     .10   .05   .15   .04   .13   .03   .11
                         20     .30   .24   .35   .22   .34   .21   .33
                         30     .50   .50   .58   .50   .59   .51   .61
                         40     .68   .71   .76   .73   .78   .76   .82

             1 sigma     10     .50   .50   .78   .54   .84   .63   .90
                         20     .93   .96   .99   .99   .99   .99   .99
                         30     .99   .99   .99  1.00  1.00   .99  1.00
                         40     .99  1.00  1.00  1.00  1.00  1.00  1.00

      .025   .5 sigma    10     .29   .23   .34   .21   .32   .20   .32
                         20     .56   .57   .63   .58   .65   .60   .68
                         30     .75   .79   .82   .81   .84   .86   .88
                         40     .87   .91   .92   .93   .94   .96   .96

             1 sigma     10     .80   .88   .95   .93   .97   .96   .99
                         20     .99   .99   .99   .99  1.00   .99   .99
                         30     .99  1.00  1.00  1.00  1.00  1.00  1.00
                         40     .99  1.00  1.00  1.00  1.00  1.00  1.00
      -----------------------------------------------------------------
29 Figures 9 and 10 contain information about the lower tail of the sampling distribution when the parent distribution is skewed to the right. In general, the test based on t critical values is more robust than that based on z. However, neither t nor z meets our criterion for robustness, even when the distributions are only slightly skewed. There are only two cases where robustness is obtained for samples of size 200 or less. One case is for parent distributions with slight skewness (G1 = 1) at the .005 level, where t is robust at about sample size 140 to 160 and z is robust at about sample size 200. Another case is for the same parent distribution at the .025 level, where t is marginally robust at about sample size 140.
 Figure 9 (8.2K gif)
Figure 9. Comparison of Observed Lower-Tailed Alphas for t and z at the .005 Nominal Level for Samples from the Normal and Skewed Distributions. The dark gray area indicates the robustness bounds; the light gray area shows the confidence bounds for the simulation.
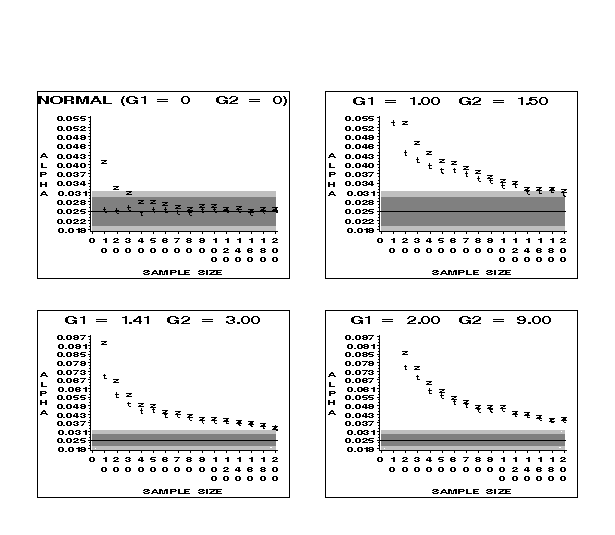 Figure 10 (8.9K gif)
Figure 10. Comparison of Observed Lower-Tailed Alphas for t and z at the .025 Nominal Level for Samples from the Normal and Skewed Distributions. The dark gray area indicates the robustness bounds; the light gray area shows the confidence bounds for the simulation.
30 The results of this research provide some insight into whether the large-sample/small-sample distinction should be taught in a basic statistics course. The following points suggest that t critical values should be used when n >= 30 and, therefore, the large-sample/small-sample approach should not be taught.
31 In light of these findings, we suggest teaching that t critical values are used regardless of sample size. In courses where data analysis includes techniques for detecting skewness in the data and the use of alternate tests for non-normal data, the following may be an appropriate teaching sequence.
32 If the instructor teaches that t critical values should be used regardless of sample size, some method may be needed for selecting critical values or determining P values from t-tables containing limited numbers of degrees of freedom (df). (Of course, as the use of the computer for conducting this test becomes the usual and P values are used from the output, questions of incomplete printed tables may become moot.) Most t-tables in textbooks have some degrees of freedom above 30, with 40, 60, 120, and infinity being a common sequence. One option when the exact df is not in the table is to use the next larger df, providing a test that is at least as robust as the z-test. Another option is to use the next smaller degrees of freedom providing a conservative test, and another option is to interpolate. More extensive tables could be provided in textbooks by including the following degrees of freedom above 30: 40, 50, 60, 70, 80, 90, 100, 110, 120, and infinity. This would add only five lines to most tables, while providing a very useful array of degrees of freedom.
33 Finally, there are cases for smaller sample sizes where z critical values may have some advantage over t critical values. (This, of course, has no effect on whether to use the large-sample/small-sample distinction.) These cases include populations with extremely high kurtosis and populations with skewness in the same direction as the tail being tested. In these cases, z critical values provide slightly more power than t, although t provides a smaller alpha. (We would expect this since tests with larger alphas do inherently have more power.) Because this occurs for the smaller sample sizes, it may be very difficult to detect the population shape by observing the sample data. However, if the researcher has knowledge of the population shape, z critical values may be chosen over t critical values in these cases.
Bartlett, M. S. (1935), "The Effect of Non-Normality on the t Distribution," Proceedings of the Cambridge Philosophical Society, 31, 223-231.
Box, G. E. P., and Cox, D. R. (1964), "Analysis of Transformations" (with discussion), Journal of the Royal Statistical Society, Ser. B, 26, 211-252.
Bradley, J. V. (1980), "Nonrobustness in Z, t, and F Tests at Large Sample Sizes," Bulletin of the Psychonomics Society, 16(5), 333-336.
Chaffin, W. W., and Rhiel, G. S. (1993), "The Effect of Skewness and Kurtosis on the One-Sample t Test and the Impact of Knowledge of the Population Standard Deviation," Journal of Computation and Simulation, 46, 79-90.
Cressie, N. (1980), "Relaxing Assumptions in the One Sample t-test," Australian Journal of Statistics, 22(2), 143-153.
Geary, R. C. (1947), "Testing for Normality," Biometrika, 34, 209-242.
Hamburg, M., and Young, P. (1994), Statistical Analysis for Decision Making (6th ed.), Orlando, FL: The Dryden Press.
IMSL, Inc. (1989), STAT/LIBRARY User's Manual: Fortran Subroutines for Statistical Analysis, Version 1.1, Vol. 3, Houston, TX: Author.
Johnson, J. J. (1978), "Modified t Tests and Confidence Intervals for Asymmetrical Populations," Journal of the American Statistical Association, 73, 536-544.
Johnson, N., and Kotz, S. (1994), Continuous Univariate Distributions (2nd ed.), New York: John Wiley.
Markowski, E., and Markowski, C. (1989), "Evaluation of Normal Scores Procedures for the Contaminated Normal Model," in Proceedings of the 1989 Northeast Decision Sciences Annual Meeting, Baltimore, MD.
McClave, J. T., and Benson, P. G. (1991), Statistics for Business and Economics (5th ed.), San Francisco: Dellen/Macmillan.
Nair, A. K. N. (1941), "Distribution of Student's t in the Correlation Coefficient in Samples from Non-Normal Populations," Sankya, 5, 383-400.
Neyman, J., and Pearson, E. S. (1928), "On the Use and Interpretation of Certain Test Criteria for Purposes of Statistical Inference: Part I," Biometrika, 20A, 175-240.
Pearson, E. S., and Please, N. W. (1975), "Relationship Between the Shape of Population Distribution and Robustness or Four Simple Testing Statistics," Biometrika, 62, 223-241.
Pocock, S. J. (1982), "When Not to Rely on the Central Limit Theorem -- An Example from Absentee Data," Communications in Statistics, Part A -- Theory and Methods, 11(19), 2169-2179.
Scheffe, H. (1959), The Analysis of Variance, New York: Wiley.
Sophister (1928), "Discussion of Small Samples Drawn from an Infinite Skew Population," Biometrika, 20A, 389-423.
Subrahmaniam, K., Subrahmaniam, K., and Messeri, J. Y. (1975), "On the Robustness of Some Tests of Significance in Sampling From a Compound Normal Population," Journal of the American Statistical Association, 70, 435-438.
Wardrop, R. L. (1995), Statistics: Learning in the Presence of Variation, Dubuque, IA: Wm. C. Brown Publishers.
G. Steven Rhiel
sxr100f@economy.bpa.odu.eduWilkie W. Chaffin
wwc100f@economy.bpa.odu.edu
Department of Information Systems/Decision Sciences
College of Business and Public Administration
Old Dominion University
Norfolk, VA 23529