The Mathematics of Networks

Current MAM Home Page || Previous MAWs/MAMs || Current Activities


|
From SIAM News, Volume 37, Number 4, May 2004 Understanding Large-Scale Social and Infrastructure Networks: A Simulation-Based ApproachBy Christopher L. Barrett, Stephen Eubank, V.S. Anil Kumar, and Madhav V. Marathe Urban transportation systems, national electric power markets and grids, the Internet, ad hoc communication and computing systems, and public health are all large, complex systems that share an important feature: They are networked -- that is, individual agents/components interact only with specified other sets of components. The links in these networks can be real or simply a matter of convention, depending on the specific system being represented. In such systems, called "socio-technical systems," one or more social networks interact with one or more underlying physical networks. In a deregulated electric power market, for example, the social network representing the bilateral contracts between buyers and sellers interacts with the underlying physical electric power network. The eventual flow of electricity agreed to in these contracts moves over the underlying electric transmission network. See [1,12] for an in-depth state-of-the-art survey on the structure and complexity of complex networks. The LANL Simulation SuiteOver the last fifteen years, researchers in the Basic and Applied Simulation Science group at Los Alamos National Laboratory have worked with various collaborators on the modeling, simulation, and development of associated decision support tools for understanding large socio-technical systems. The extremely detailed multiscale computer simulations allow individual agents (e.g., people, cars, digital devices) to interact among themselves, as well as with the environment and the networked infrastructure. Such simulations are helpful to policy makers and infrastructure planners who need to answer specific questions. Additionally, our formal results show that simulation-based methods are both necessary and sufficient for understanding the dynamics of such complex systems [4-5]. The mathematical and computational theory views simulations as certain kinds of discrete dynamical systems and provides formal methods for the design, specification, and analysis of such simulations [3-5,11]. Unlike physical systems, socio-technical systems are affected not only by physical laws but also by human behavior, regulatory agencies, and government and private enterprise. The simulation of such systems thus presents novel challenges to researchers. Urban transportation systems constitute a canonical example of the types and levels of interactions that characterize these systems: Traffic rules in distant parts of a city can have an important bearing on traffic congestion downtown, and seemingly "reasonable" strategies, such as adding a new road somewhere, might actually worsen the congestion [7]. The recent failure of the electric power grid in the northeastern U.S. highlighted the complicated interdependencies, both within and among socio-technical systems, and the need to develop new tools that accommodate these interdependencies. The failure of the power grid led to cascading effects that slowed Internet traffic, closed down financial institutions, and threw transportation systems out of control. Our interdependent simulation suite provides a controlled mechanism for representing such interactions among these social and technical networks (see Figure 1). It covers the following sectors: transportation (TRANSIMS), urban population mobility (UPMoST), public health (EpiSims), telecommunication (AdHopNET), and commodity markets (Marketecture). Details can be found at http://www.ccs.lanl.gov/ccs5. 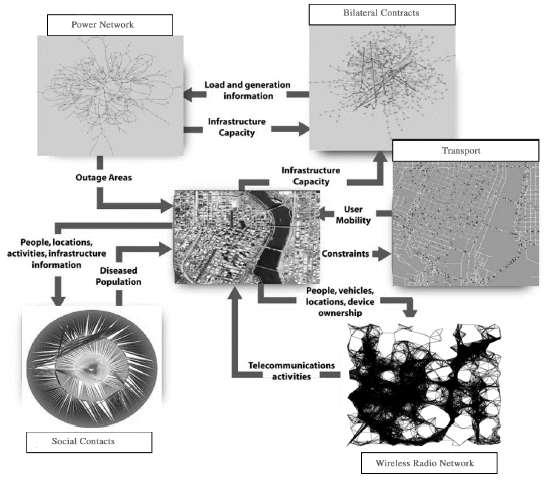
Figure 1. Architecture and components of the interdependent suite of infrastructure simulations developed at Los Alamos National Laboratory. The social-contacts network at the lower left is a fragment of the complete network and is obtained by looking at a single family (center) and tracing their contacts up to distance 3, which involves considering all nodes in the graph within distance 3. The wireless ad hoc network at the lower right is obtained by placing radio transceivers along city streets. The bilateralcontracts network at the upper right shows contracts between supplier and consumer pairs in the city. The simulations are based on a formal mathematical and computational theory of socio-technical simulations, together with novel methods for the design and analysis of large dynamic networks, and efficient data compression and regeneration techniques. The social and infrastructure networks we study are extremely large, consisting of millions of nodes and links. As a result, the simulations are capable of representing, in extreme detail, millions to tens of millions of interacting agents. Using TRANSIMS, for instance, we can represent every individual in Portland, Oregon, on a second-by-second basis at a spatial resolution of approximately 7 meters. Portland's approximately 1.6 million inhabitants take roughly 8 million trips in one day. The multimodal Portland transportation network consists of half a million nodes. Because of the scale of the systems to be represented and analyzed, all our simulations are specifically designed to execute efficiently on high-performance computing platforms. The associated algorithms often exploit the characteristics of the complex systems and use sampling methods to reduce the computation time. A number of policy-planning and design studies have made use of our interdependent suites of simulations. TRANSIMS has been an important component of large case studies in Albuquerque, Dallas-Ft. Worth, and most recently Portland, Oregon. EpiSims, which couples the transmission of disease with the mobility of urban populations, has also been used in several national case studies of effective response to outbreaks of infectious diseases. Analysis of Socio-Technical SystemsTypically, coarse-grained static structural analysis of sociotechnical networks is combined with more sophisticated simulation-based dynamic analysis. Together, these analyses provide useful insights for scientists, planning personnel, and policy makers who need to incorporate specific operational goals into such networks. The static structural analysis of sociotechnical networks shows both interesting similarities and differences that arise from the way these networks form and the functions they perform [6,8-9]. A better understanding of the differences between these networks and the applicability of different random graph models [1,12] to such networks requires a deeper examination of their properties. Table 1 presents a summary of some important properties. A few definitions are helpful for understanding the table: The "degree" of a node is the number of neighbors connected directly to it. The "clustering coefficient" of node i is given as ci = 2ni/[ki (ki - 1)], where ni is the number of edges between the neighbors of i and ki is the degree of i. The "diameter" of the network is the maximum, over all pairs of nodes u and v, of the shortest-path distance between u and v. Some observations that follow from the results in [1,6,8-10,12] are:
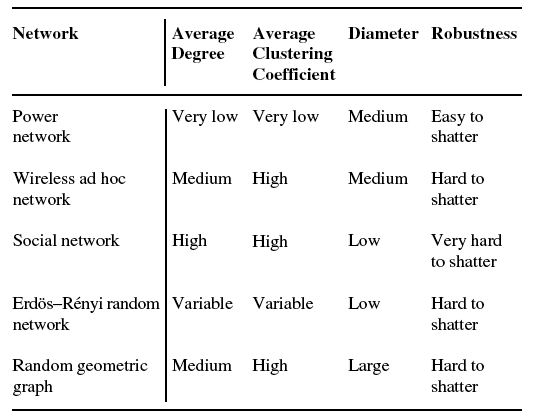
Table 1. Qualitative comparison of structural parameters for some real social and infrastructure networks and random networks. The Erdös-Rényi random graph is obtained by placing each edge between a pair of vertices independently with a given probability. The random geometric graph is obtained by placing points in a unit square uniformly at random and adding edges between points that are within a chosen threshold value of distance. Informally, we say that a graph is robust if deletion of a few edges/nodes does not break the network into smaller components. Our results show that robustness and reliability are different for social and infrastructure networks. Figure 2 shows the relative ease with which various social and infrastructure networks can be "shattered." We found the most robust class of networks to be social networks, followed by mobile ad hoc networks. The least robust are transportation and electric power networks. One reason for the relative robustness of social networks is their similarity to "expander graphs"; ad hoc networks, by contrast, resemble random geometric graphs. The vertex expansion of a set P' ⊂ P is the ratio between the number of distinct vertices not in P' that are reached through edges emanating from P', and the number of vertices in P', denoted by |P'|. The vertex expansion of the graph GP is defined as the minimum of the vertex expansions of all sets P' with |P'| ≤ NP/2. Expander graphs are graphs with high vertex expansion. Intuitively, high expansion means that any two vertices are joined by a number of disjoint paths. Power networks and transportation networks have low expansion; as a result, targeted attacks of high-degree nodes are more effective than random attacks in power and transportation networks. The expansion properties of social networks, by contrast, make them hard to break. These results have important implications for policy planners and designers: Infectious diseases, for instance, are likely to spread quickly if not controlled early enough. 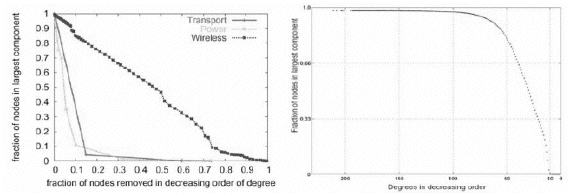
Figure 2. Size of the largest component in a network as a function of the fraction of nodes deleted. Nodes were deleted in decreasing order of residual degree. The left-hand panel depicts transportation, power, and wireless radio networks; the right-hand panel represents a social-contact network in a city. Sample Dynamic AnalysesPolicy planners look for quick answers to "what if" questions: What would happen if this cell tower became nonoperational? What would happen if the people in that group were vaccinated? The following examples illustrate the diverse types of dynamic analyses that have been performed with our tools. Effects of mitigation strategies. To compare the impact of different vaccination strategies, we simulated a smallpox attack in a city [9]. In our scenario, about a thousand people were infected in busy locations over several hours. The results of static analysis suggest that early detection is important for effective control of the outbreak of disease (see Figure 3). 
Figure 3. Effects of mitigation strategies: The dark bars show the number of infected people at different locations in Portland, Oregon. Left, geographic distribution of infected people in the city 6 hours after the start of an outbreak. Middle, distribution of infected people 40 days after the initial outbreak, with no mitigation efforts implemented. Right, distribution 40 days after isolation and vaccination of infected and contagious individuals; notice that fewer people are infected and far fewer people are contagious. Optimal design of ad hoc networks. In this example static network analysis and detailed simulations combined to produce a design for an ad hoc network with very good performance (see [6,10]). The problem is to find an assignment of transmission power levels (measured as the maximum distance over which radio signals can be heard) to individual transceivers so as to obtain a network that maximizes the overall system throughput. Choosing high power levels improves connectivity, leading to short paths between nodes, but also leads to high levels of radio interference. The radio interference at the media-access layer (MAC) is modeled combinatorially as distance-2 edge matchings -- that is, as a set of edges that do not have any edges between them. In Figure 4, the left-hand panel shows the trade-off between the reciprocal of average path lengths and the size of distance-2 edge matchings plotted as a function of the distance over which individual transceivers can send packets; the right-hand panel shows the actual performance of the network as a function of power levels. 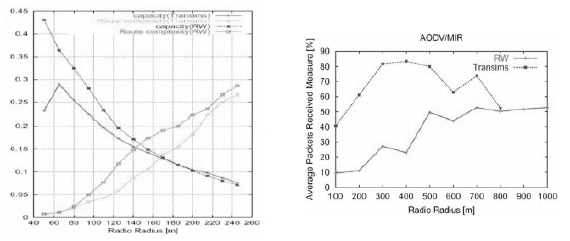
Figure 4. Performance trade-offs in radio networks generated by random distribution of locations (RW) of transceivers versus a network generated by transceivers placed on all cars, in the traffic generated by TRANSIMS. Left, trade-off between the reciprocal of average path lengths and MAC-layer network capacity measured as distance-2 edge matchings. Notice that while the average path length decreases with increasing radio power level assigned to individual transceivers, the MAC-capacity measured by distance-2 edge matching first increases and then decreases beyond a certain power level. The degradation in MAC-capacity results from increased radio interference. The intersection of the two curves suggests the possibility of assigning optimal transmission power levels for individual transceivers. Right, number of packets successfully transmitted as a function of transmission power assigned to each radio and obtained by running a packet-level communication network simulator. Efficiency of market clearing rules. Marketecture has been used to evaluate the efficiency of various market clearing mechanisms and strategies of the generators in the electricity market. The Marketecture team at Los Alamos performed a study to evaluate the efficiency of the electricity market under three market clearing mechanisms and three electricity generators' bidding strategies. The market clearing mechanisms are: (i) marginal price clearing, (ii) Vickrey auction clearing, and (iii) weighted average price clearing. The generators used (i) competitive (C), (ii) oligopolist (O), and (iii) competitive-oligopolist (X) strategies. In the marginal price clearing mechanism, the generators are called in merit order; the cheapest generator is called in first, followed by the next cheapest, and so on until all the demand is served. The market clearing price is determined by the "ask" of the marginal generator, i.e., the price offered by the last generator called in to serve the demand. In the Vickrey clearing mechanism, price is determined by the cheapest generator not called in to serve the demand; the generators are still dispatched in merit order. The Vickrey auction policy was designed to induce a truthful revelation of production costs and efficient dispatching of generators by decoupling the pay-off of the generators from their bid price [13]. In weighted average clearing, the market clearing price is the weighted average price of the generators called in to serve the demand. The weights are the quantities offered by the generators called in. A generator bids at cost in a competitive strategy and at higher than cost in an oligopolist strategy; a competitive-oligopolist strategy uses a randomly chosen point between the competitive and oligopolist strategies. See [2] for additional details. The graph in Figure 5 shows the deadweight loss (DWL) to society, profits to the generators, and consumer surplus under each of the nine scenarios. Consumer surplus is measured as the difference between the amount of money that consumers actually pay for quantity x and the amount they would be willing to pay for quantity x rather than do without it. Profits (or producers' surplus) of the generators is simply the revenue minus the cost. The DWL is the proportion of total surplus (profits plus consumer surplus) in society that goes neither to the consumers nor to the generators. 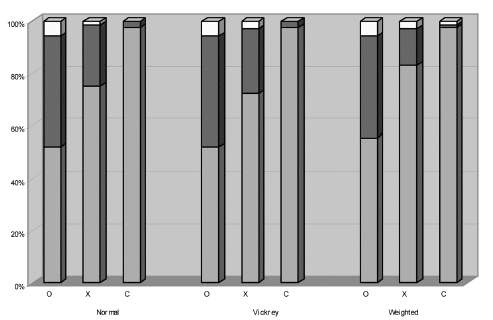
Figure 5. Market efficiency under different market clearing rules and seller strategies. The nine combinations are grouped by market clearing mechanism. White indicates dead-weight loss; dark gray, profit; and light gray, consumer surplus. The results show that the uniform marginal price clearing mechanism combined with the competitive bidding strategy leads to maximum market efficiency. The second best outcome occurs when a Vickrey auction clearing mechanism is used, and generators actually reveal their true production costs and bid at competitive levels. The market loses only 1-2% of its efficiency under such a scenario. If Vickrey auction clearing is not successful in inducing generators to bid at competitive levels, however, the oligopolistic behavior of generators leads to the lowest market efficiency. This can easily occur when there is excess demand in the system and generators can exercise market power. But if Vickrey auction clearing gives generators enough incentive to move from an oligopolist to a competitive-oligopolist strategy, the result can still be a reduction in the dead-weight loss to society and, hence, an increase in market efficiency of more than 11%, and in the consumer surplus of 13% -- a desirable outcome. References
[1] R. Albert and A. Barabási, Statistical mechanics of complex networks, Rev. Mod. Phys., 74 (2002), 47-97.
Christopher Barrett (barrett@lanl.gov), Stephen Eubank (eubank@lanl.gov), V.S. Anil Kumar (anil@lanl.gov), and Madhav Marathe (marathe@lanl.gov) are technical staff members in the Basic and Applied Simulation Science group, Computer and Computational Science Division, at Los Alamos National Laboratory. The results described here are the collective contribution of the group, along with all of its collaborators. Download this article as a PDF (1.7M). |
| Mathematics Awareness Month is sponsored each year by the Joint Policy Board for Mathematics to recognize the importance of mathematics through written materials and an accompanying poster that highlight mathematical developments and applications in a particular area. |