The Mathematics of Networks

Current MAM Home Page || Previous MAWs/MAMs || Current Activities
|
From SIAM News, Volume 37, Number 4, May 2004 The Origins of the Internet MapBy Bill Cheswick The original motivation for the Internet Mapping Project came from a conference in Annapolis, a Navy-sponsored "Highlands Forum"" that I attended in 1996. Held in Annapolis, the meeting was designed to help brief a member of the newly formed National Infrastructure Protection Commission. Participants included people like the well-known technology-industry commentator Esther Dyson and Fred Cohen, author of the first PC virus and a pioneer in Internet security. (One spook informed Fred and me that they had a psych profile for people like us: We have "sublimated criminal tendencies.") Our task was to run an exercise from the RAND Corporation, called "The Day-After Scenario." The scene was ten years in the future, and a series of events had just occurred. We were supposed to analyze these events, and then brief the president. The events themselves were various "buzzword-compliant" attacks on various parts of the national infrastructure. (It was interesting to me that none of the attacks were on the Internet itself.) The attacks were somewhat tentative, leading us to wonder if they were related. Then we were to move forward a week, when a set of much nastier buzzword-compliant attacks occurred. Again, we conferred and then advised the president. In the final step, we tried to figure out what we could do in 1996 to prepare for such attacks. I recalled that in the early days of the arpa/milnet, the milnet would disconnect from the more public arpanet at the first sign of trouble. Would the military be able to do that in 2006? To have a chance, they would need a map. There was a growing need for Internet mapping in other areas as well. The Bell Labs intranet, for example, had grown without much oversight from AT&T. It was a mess. The recent trivestiture had left shards of networks from AT&T, NCR, and old business partners dangling from Lucent's intranet. That network could be explored with the same mapping techniques. And I had heard similar complaints from CIOs at a number of conferences. In 1977, Hal Burch joined me at Bell Labs as a summer intern, and we worked together on a couple of projects. We developed software to explore large networks quickly, and with a light touch: we didn't want upset Internet denizens pressuring our boss to cancel the project. Burch also worked out software for visualizing the large datasets we collected. We used well-known brute-force techniques to lay out graphs that were three orders of magnitude larger than those traditionally considered "large" by the visualization community. That community had overlooked Moore's law: Our layouts took almost a day to produce on a fast Pentium CPU of the time. The visualizations were an instant hit. People covering the Internet now had something to show other than three geeks staring at a Web browser. Wired ran our map in December 1998 (not, alas, as a fold-out). According to our Bell Labs colleague Dave Presotto, the image looked like a peacock smashed on a windshield. Though it was complicated, the peacock visualization actually gave some insights into the data. Burch spotted a bug in the data I was using. Connectivity to certain countries and companies was clearly visible. The analysis of the Lucent intranet found many dregs: deprecated connections to business partners and a university, and even a host owned by a competitor. Lucent's network staff worked on these problems over the months, and the Lucent map got cleaner and cleaner. We developed techniques to find leaks in intranet perimeter defenses, which are actually more important than the maps. In 2000, some of us moved to the Lucent New Ventures, obtained outside funding, and spun off Lumeta Corporation to commercialize this and related technologies. Our company is growing nicely, and we have more than 70 clients in industry and government who are getting more control over their intranets. And each new map is cool. 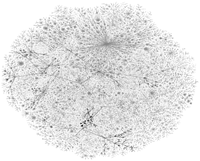
Bill Cheswick, chief scientist at Lumeta Corporation, a Lucent/Bell Labs spinoff, began work on the Internet map featured on the Mathematics Awareness Month 2004 poster (and shown above, alas, much reduced and in black and white) as a researcher at Bell Labs. |
| Mathematics Awareness Month is sponsored each year by the Joint Policy Board for Mathematics to recognize the importance of mathematics through written materials and an accompanying poster that highlight mathematical developments and applications in a particular area. |