The Mathematics of Networks

Current MAM Home Page || Previous MAWs/MAMs || Current Activities


|
From SIAM News, Volume 37, Number 4, May 2004 Molecular Interaction Maps of Bioregulatory NetworksBy Kurt W. Kohn and Mirit I. Aladjem The biological function and behavior of cells are regulated by networks of interacting molecules whose logic is far more complicated than any human-designed electronic device or robot. The components of biological networks are constantly moving about and able to interact in many different ways, depending on what other components they may encounter. The networks are so rich in cross-connections, and so successful in masking underlying order, that understanding their functional mechanisms is a major challenge. We must nevertheless meet this challenge in order to utilize modern molecular biology most effectively against diseases, such as cancers, that arise from defects in cell regulation. As a first step, we must organize the molecular information in the form of diagrams that can be used in the same way that circuit diagrams are used to trouble-shoot electronic devices. Researchers in molecular biology usually still rely on cartoon-like diagrams that are incomplete and often ambiguous, or on diagrams that show the general pattern of effects, but that do not show the detailed mechanisms. An arrow between two components, for example, could signify any of several possibilities: that one increases the activity of the other, that it increases the quantity of the other, that it modifies the molecular state of the other, or that it moves toward the other. Simply using different kinds of arrows to resolve this ambiguity, however, does not resolve the difficulties, mainly because of three unique features of bioregulatory networks:
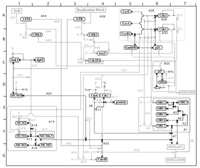
A given molecule can thus have different interaction capabilities, depending on the other molecules to which it is bound and on its modification state, as well as those of its partners. Moreover, a molecule can have multiple phosphorylation sites, and each phosphorylation can have a different effect. This multiplicity of binding and modification possibilities allows a given molecule to exist in a large number of alternative functional states. Another important feature is that regulatory proteins are often composed of domains, each with its own binding, modification, or enzymatic capabilities. Different domains within the same molecule sometimes interact with each other. All of these interactions must be taken into account for a full understanding of the system. Adequate diagrams of bioregulatory networks will require a specially designed standard notation that can cope with the major complexities and that can be understood by anyone in the field. We have proposed a notation that we believe meets these requirements [2-5] (see Figure 1). A basic feature of our notation is that each monomolecular species (excluding small or ubiquitous molecules) is represented in a single place in a diagram. All of the interactions of a given molecule can then be traced from a single location. There are two general classes of interactions: (1) reactions, such as binding, cleavage, and stoichiometric conversion; (2) contingencies, such as stimulation, inhibition, and enzymatic catalysis. These different types of interactions are represented by specifically defined arrowed (or end-barred) lines connecting the interacting molecules. Another basic feature of the notation is that multimolecular complexes and their consequences are represented by nodes (small filled circles placed on the interaction lines), which can be connected by reaction or contingency lines in the same manner as monomolecular species. The symbols and conventions used in this notation, as well as examples of molecular interaction maps, can be accessed at our Web site: http://discover.nci.nih.gov/mim. 
Figure 1. A molecular interaction map describing the formation of a complex of proteins that is required to begin DNA replication in animal cells. Detailed descriptions of the molecules involved and their interactions can be found at http://discover.nci.nih.gov or http://www.stefaniapasa.it/RepMap. The monomolecular species can be located, like towns on a road map, by way of map coordinates that are listed, together with other information, in an alphabetical glossary. Each interaction is labeled with a symbol that links to an annotation list, where salient details and references can be found. Our Web-based molecular interaction maps also have automatic links to other databases. In addition, our notation can be used to generate diagrams that define model systems for study by computer simulation [1,3]. A major task that lies ahead is to compile and update maps of the major biological control systems, and to integrate them in a concise manner. We may then discern common patterns of molecular interaction logic that give bioregulatory networks their remarkable flexibility and robustness. References
[1] K.W. Kohn, Functional capabilities of molecular network components controlling the mammalian G1/S cell cycle phase transition, Oncogene, 16 (1998), 1065-1075.
Kurt W. Kohn and Mirit I. Aladjem are researchers in the Laboratory of Molecular Pharmacology at the Center for Cancer Research, National Cancer Institute, National Institutes of Health. |
| Mathematics Awareness Month is sponsored each year by the Joint Policy Board for Mathematics to recognize the importance of mathematics through written materials and an accompanying poster that highlight mathematical developments and applications in a particular area. |